Monday, May 20, 2013

Commodity Channel Index [CCI]

The commodity channel index (CCI) is an oscillator originally introduced by Donald Lambert in an article published in the October 1980 issue of Commodities magazine (now known as Futures magazine).
Since its introduction, the indicator has grown in popularity and is now a very common tool for traders in identifying cyclical trends not only in commodities, but also equities and currencies. The CCI can be adjusted to the timeframe of the market traded on by changing the averaging period.
The CCI typically oscillates above and below a zero line. Normal oscillations will occur within the range of +100 and −100. Readings above +100 imply an overbought condition, while readings below −100 imply an oversold condition. As with other overbought/oversold indicators, this means that there is a large probability that the price will correct to more representative levels.
Since Lambert's original guidelines, traders have also found the CCI valuable for identifying reversals. The CCI is a versatile indicator capable of producing a wide array of buy and sell signals.
  • CCI can be used to identify overbought and oversold levels. A security would be deemed oversold when the CCI dips below −100 and overbought when it exceeds +100. From oversold levels, a buy signal might be given when the CCI moves back above −100. From overbought levels, a sell signal might be given when the CCI moved back below +100.
  • As with most oscillators, divergences can also be applied to increase the robustness of signals. A positive divergence below −100 would increase the robustness of a signal based on a move back above −100. A negative divergence above +100 would increase the robustness of a signal based on a move back below +100.
  • Trend line breaks can be used to generate signals. Trend lines can be drawn connecting the peaks and troughs. From oversold levels, an advance above −100 and trend line breakout could be considered bullish. From overbought levels, a decline below +100 and a trend line break could be considered bearish.

Monday, April 22, 2013

Relative Strength Index (RSI)

The relative strength index (RSI) is another one of the most used and well-known momentum indicators in technical analysis. RSI helps to signal overbought and oversold conditions in a security. The indicator is plotted in a range between zero and 100. A reading above 70 is used to suggest that a security is overbought, while a reading below 30 is used to suggest that it is oversold. This indicator helps traders to identify whether a security's price has been unreasonably pushed to current levels and whether a reversal may be on the way.
 The RSI is most typically used on a 14 day timeframe. Shorter or longer timeframes are used for alternately shorter or longer outlooks. More extreme high and low levels—80 and 20, or 90 and 10—occur less frequently but indicate stronger momentum.

Divergence between RSI and price action is a very strong indication that a market turning point is imminent. Bearish divergence occurs when price makes a new high but the RSI makes a lower high, thus failing to confirm. Bullish divergence occurs when price makes a new low but RSI makes a higher low.

Wednesday, April 17, 2013

Bullish Morning Star

A bullish candlestick pattern that consists of three candles that have demonstrated the following characteristics:
1. The first bar is a large red candlestick located within a defined downtrend.
2. The second bar is a small-bodied candle (either red or white) that closes below the first red bar.
3. The last bar is a large white candle that opens above the middle candle and closes near the center of the first bar's body.
In order to have a valid Morning Star formation, most traders will look for the top of the third candle to be at least halfway up the body of the first candle in the pattern.
When found in a downtrend, this pattern can be an indication that a reversal in the price trend is going to take place. 

Bearish Evening Star Formation

The first part of an Evening Star reversal pattern is a large bullish green candle. On the first day, bulls are definitely in charge, usually new highs were made.
The second day begins with a bullish gap up. It is clear from the opening of Day 2 that bulls are in control. However, bulls do not push prices much higher. The candlestick on Day 2 is quite small and can be bullish, bearish, or neutral (i.e. Doji).
Generally speaking, a bearish candle on Day 2 is a stronger sign of an impending reversal. But it is Day 3 that is the most significant candlestick.

The last bar is a large red candle that opens below the middle candle and closes near the center of the first bar's body. 

Saturday, April 13, 2013

Stochastic

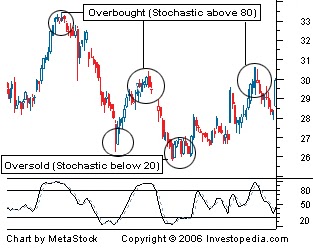
The Stochastic is another indicator that helps us determine where a trend might be ending.
By definition, a Stochastic is an oscillator that measures overbought and oversold conditions in the market. The 2 lines are similar to the MACD lines in the sense that one line is faster than the other.


The theory behind this indicator is that in an upward-trending market, prices tend to close near their high, and during a downward-trending market, prices tend to close near their low. Transaction signals occur when the %K crosses through a three-period moving average called the "%D".


Bollinger Bands

Bollinger Bands, a chart indicator developed by John Bollinger, are used to measure a market's volatility.
Basically, this little tool tells us whether the market is quiet or whether the market is LOUD! When the market is quiet, the bands contract and when the market is LOUD, the bands expand.


One thing you should know about Bollinger Bands is that price tends to return to the middle of the bands. That is the whole idea behind the Bollinger bounce.


Because standard deviation is a measure of volatility, Bollinger Bands adjust themselves to the market conditions. When the markets become more volatile, the bands widen (move further away from the average), and during less volatile periods, the bands contract (move closer to the average). The tightening of the bands is often used by technical traders as an early indication that the volatility is about to increase sharply.

This is one of the most popular technical analysis techniques. The closer the prices move to the upper band, the more overbought the market, and the closer the prices move to the lower band, the more oversold the market. 

  © ValueMCX 2011

Back to TOP